


Interactive Map Reveals Murders in Medieval London
Criminologists from the University of Cambridge have created an interactive map of murders that took place in London at the beginning of the 14th century. The map marks the locations of crimes and provides details about each incident in the form of a short story. Users can also filter the data by the victim’s gender, type of weapon, and district. The project is described on the university’s website.
How Medieval Murders Were Recorded
In medieval England, all information about sudden and mysterious deaths—including murders, suicides, and accidental deaths—was collected by the coroner, an official responsible for investigating deaths. The coroner, along with a law enforcement representative, would be called to the crime scene to interview possible witnesses and gather detailed information about the event. This data was then stored in so-called coroners’ rolls and used in court proceedings.
Details of the Cambridge Study
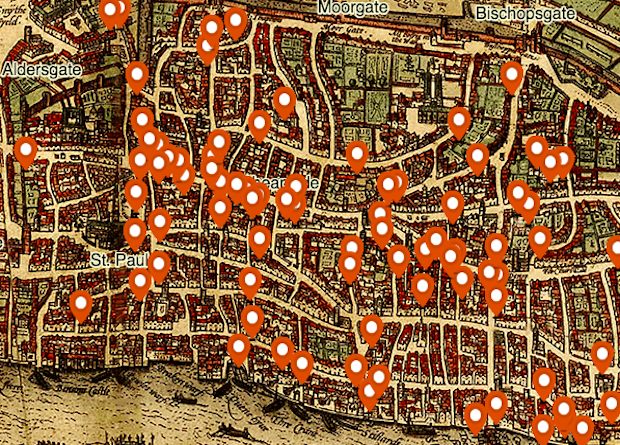
Researchers from the University of Cambridge, led by criminologist Manuel Eisner, compiled information on 142 murders committed in London between 1300 and 1340. Using open-source Google Maps technology, the researchers plotted the murders on two different maps: the Braun-Hogenberg map from 1572 and a detailed map of London published in 1270.
Map Features and Insights
The map allows users to filter information by several parameters: victim’s gender, murder weapon, type of crime scene (whether the murder was committed in public or in secret), and the district where it occurred. This interactive tool offers a detailed look into the criminal life of medieval London. In addition to the map, the researchers also published a comprehensive report, including tables with information about the time of day and day of the week the murders occurred, how quickly the victim died after the attack, and which part of the body was wounded.
- In 92% of cases, the victims were men.
- The most common murder weapon was a long knife.
- In 15 out of 142 cases, the victim survived for several weeks after the attack.
Interactive Maps as a Visualization Tool
Interactive maps are a popular way to visualize data about various events. For example, in 2016, researchers mapped all nuclear explosions that have occurred since 1945.